The Bionicle Man
Contents |
IntroductionHello dear reader! I am writing a new blog post as it would be amiss of me to miss adding a single post in the fading year of two thousand and twenty-three. During a small part of this busy busy year I have been preoccupied with my Garmin watch. My first watch model was a gift, and I initially thought it was a silly thing until I started using it. Garmin watches allow you to track your heart rate and GPS coordinates. This allows you to understand how hard you are exerting yourself and how far you went when running, cycling, swimming, etcetera. Garmin’s data sharing ability allows you to share this information with friends in order to see what new bike routes or challenges your friends have completed. This social aspect for me was the primary benefit of the watch, represented in thoughts such as: “…wait what?… so and so biked 40km across a frozen lake on a fat bike?” and “That’s an interesting cycling route. I will try that out tomorrow.” You may be thinking: “…ah another tracking mechanism that I don’t care for” or “who has got time or knowledge to view and make use of these metrics?”. These are valid concerns, but the watch is what you make of it. I found the watch great for helping me become more mindful of my breath control during exercise, training in specific heart rate zones, and changing up my exercise routes. The watches are now so advanced that they even come with a GPS map that can assist you in some of your longer routes - the technology is very advanced! Heart Rate VariabilityOutside of social and exercise metrics, I wasn’t receiving too much information about my body. It wasn’t until I upgraded to the 955 Solar Garmin watch that I started getting some additional metrics, such as stress level. At first I was very confused by this variable. How is it that I am sitting down, and this watch is claiming that I am stressed at a stress level of 80 out of 100… during a vacation where I do, and should feel calm? The stress metric is based on the heart rate and heart rate variability (hrv). Garmin scales the metrics from 0 to 100 in order of increasing stress. Below is a sample image of Garmin watch view of my stress during a morning where I had to go for an early flight. 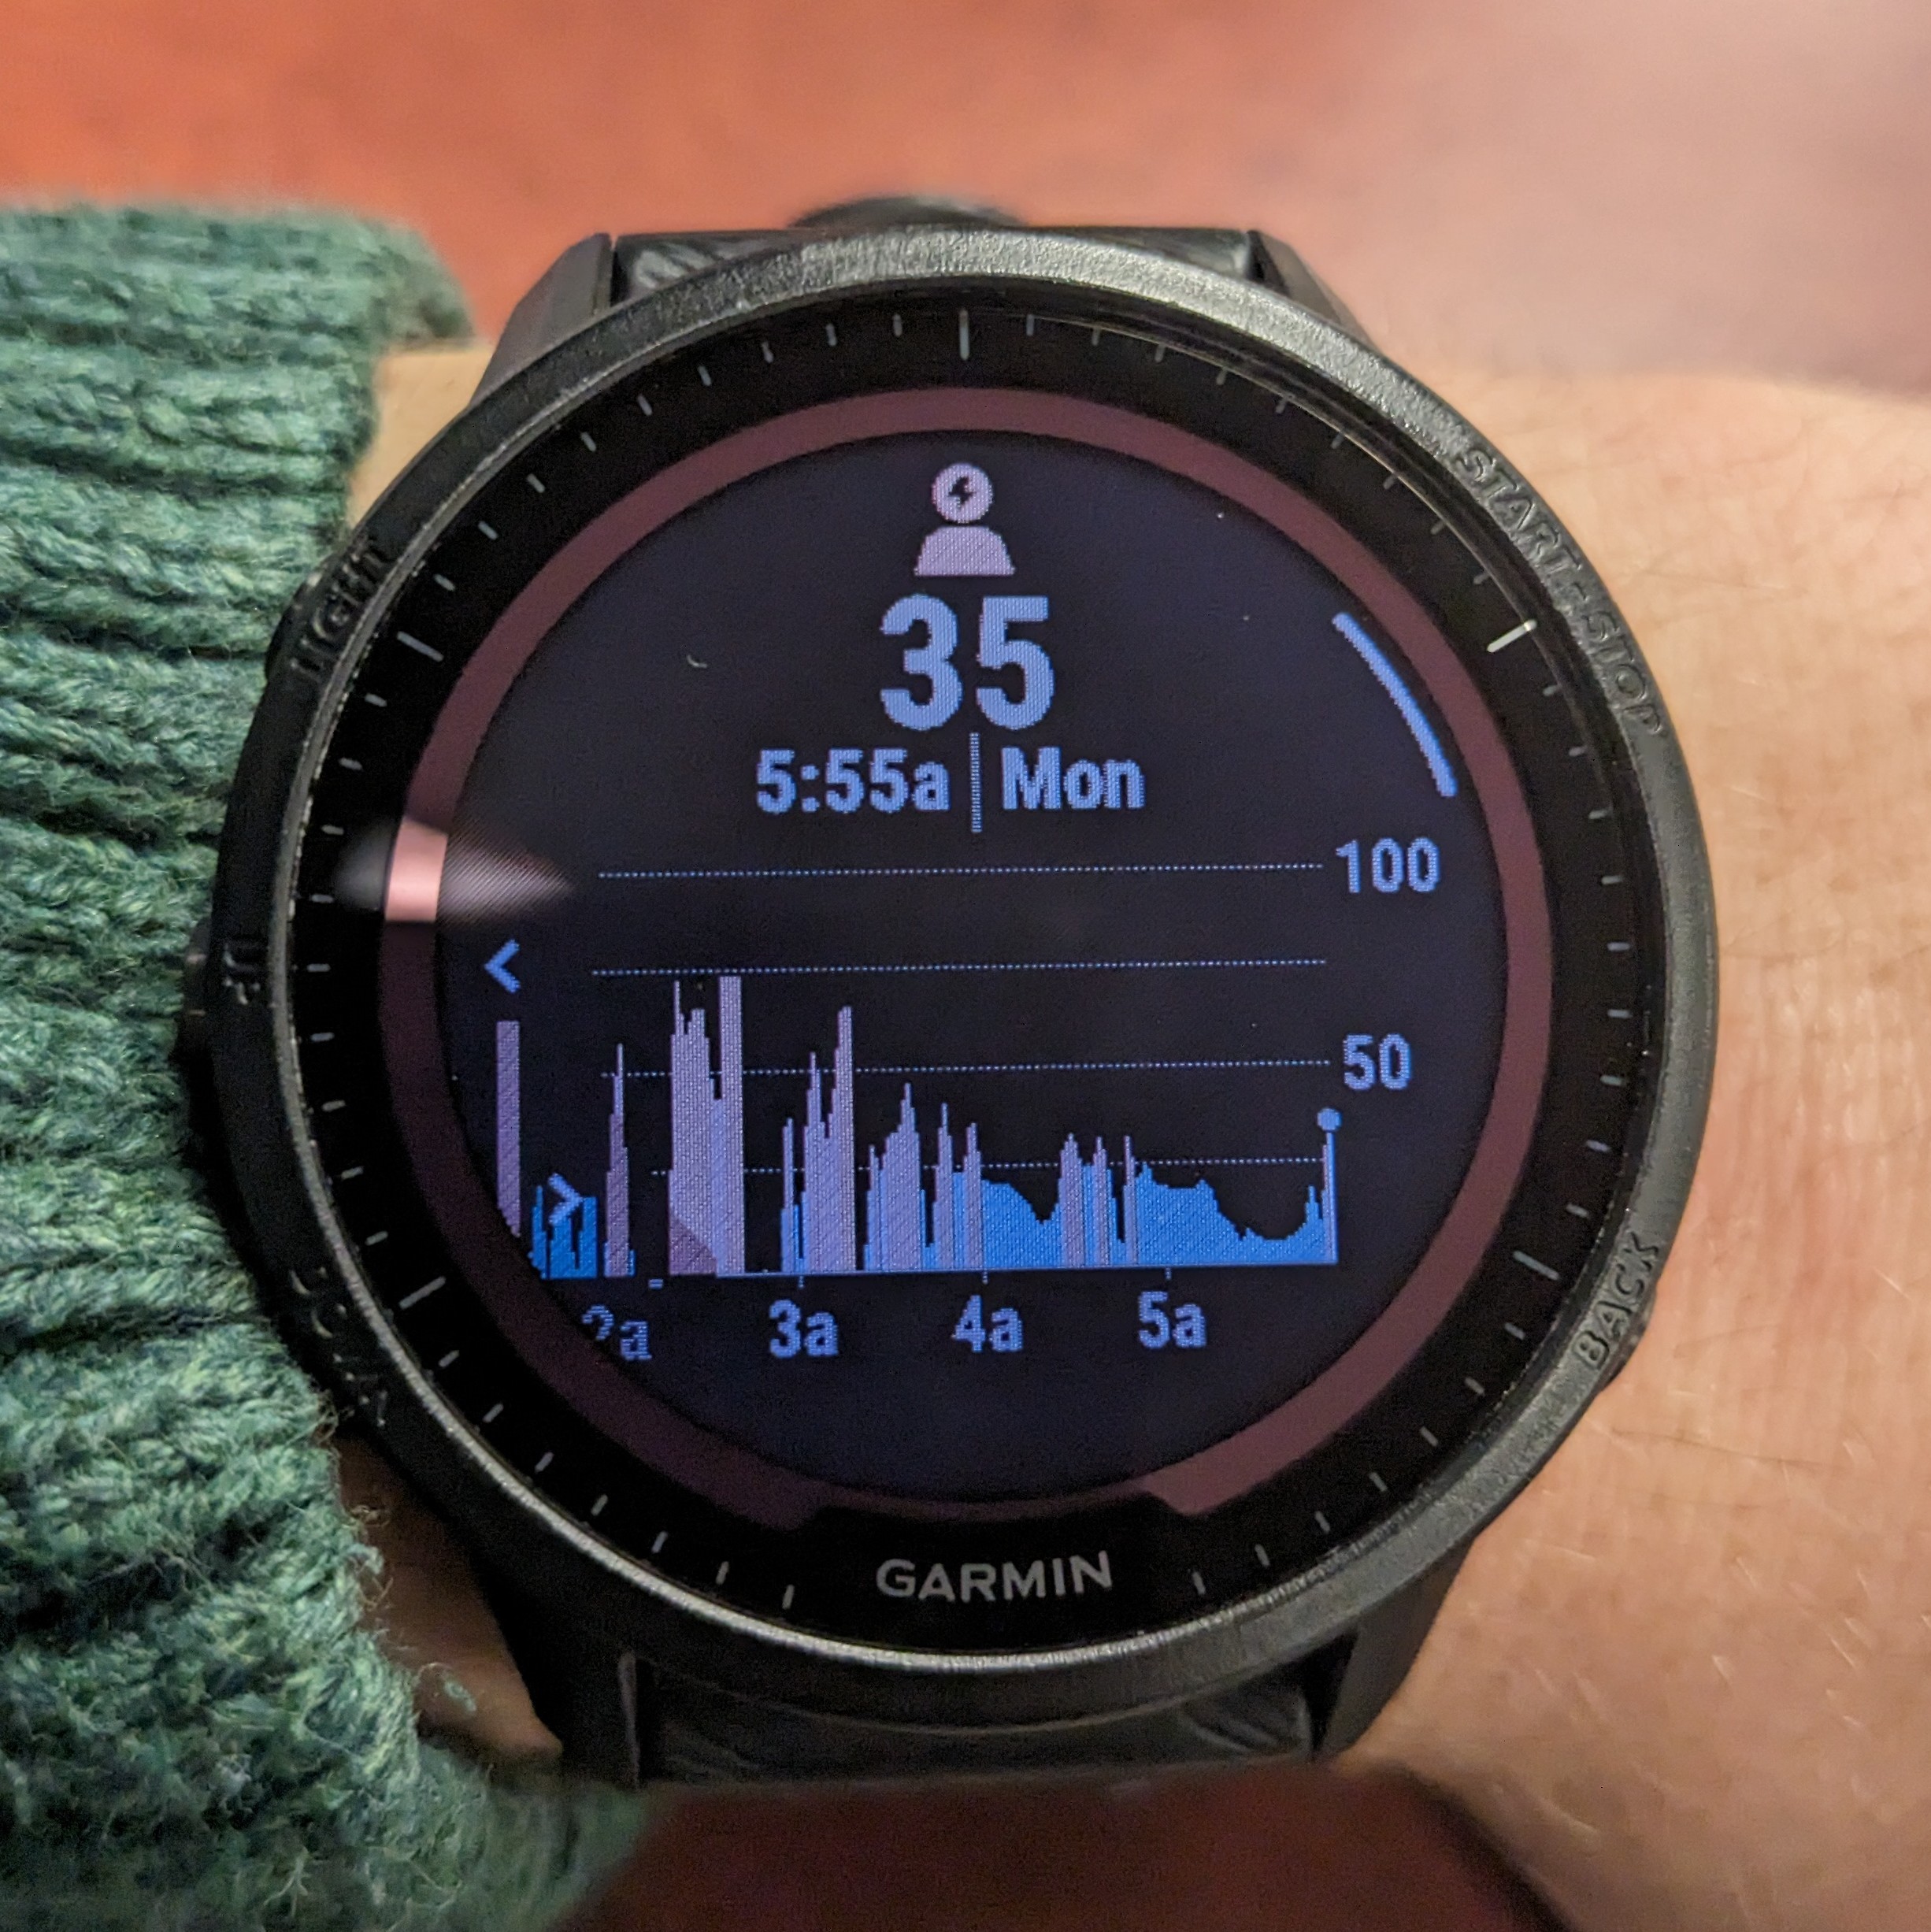
The stress metric was not immediately available from the watch’s resting face, and I had to press one of the side buttons to see the live data. I was so preoccupied with all of this that my friend nicknamed me the “Bionicle Man”. Half man, half robot - obsessed and hunched over my watch, looking at my metrics throughout all moments of the vacation. The Watch AppI decided to combine my old love for little programming projects with this new found curiosity in the dynamic stress metric. Fortunately, Garmin has a wonderful software development kit and detailed forums that allows one to create their own watch faces and apps. I set out to create a stress monitoring watch! Unfortunately, when programming the watch face, one cannot get access to a ‘live’ stress metric. Therefore, I used the next best thing for displaying live stress data, which was the live heart rate, as these two fields are correlated. I created a watch face with a graph that displayed the heart rate for the past three minutes, and that refreshed every second. I colour coded the heart rate in the graph in order to communicate to the user when their heart rate was exceeding a resting rate. Take a look at the resulting watch face: 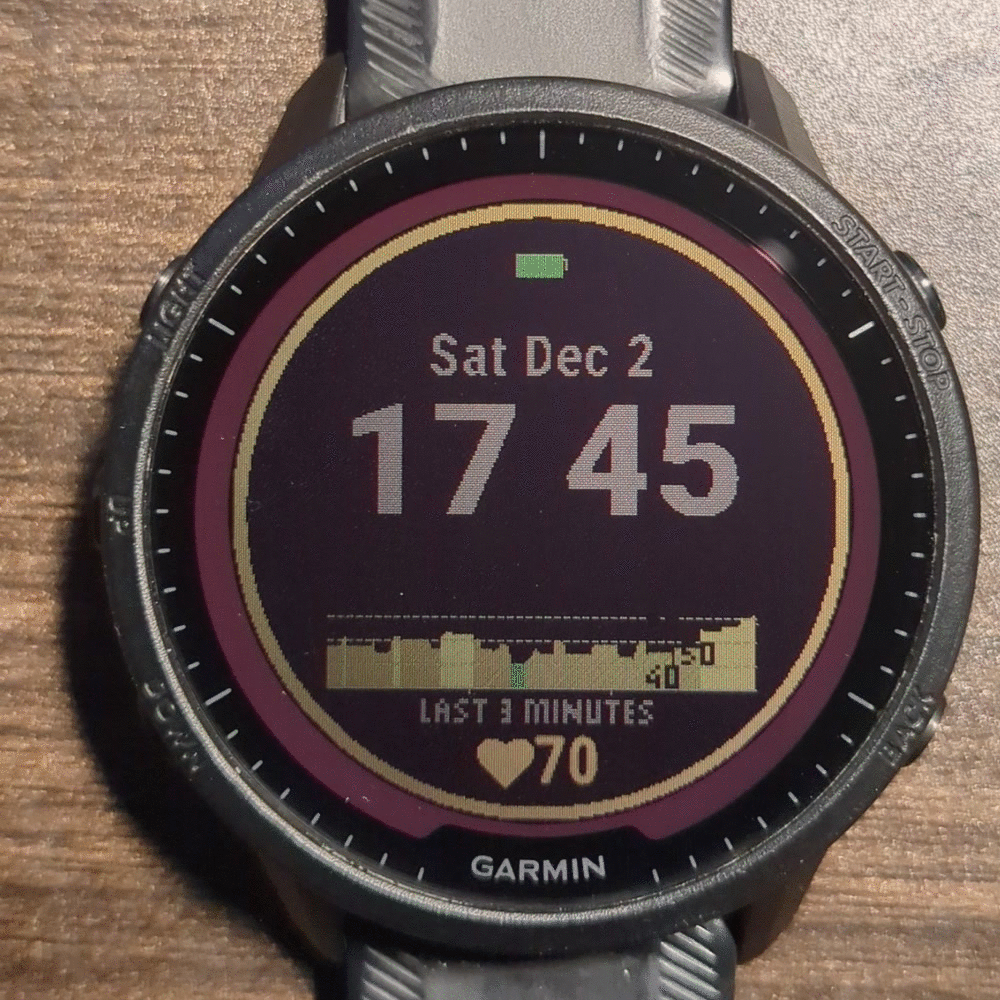
You can see the code at https://github.com/mannyray/StressWatchFace This graph allows you to look into the history of your heart rate; to see if your heart rate is accelerating or decelerating. For the gif above, I modified the code to allow for playback of live recorded data, to demonstrate how the watch face works (it’s not actually measuring the pulse of the table). For the represented data, I started in a sitting position, stood up did some jumping jacks, and at last I sat back down. My heart started at a resting rate in the 40’s/50’s and then went up to the 90’s, and then went back down to resting. The gif shows minute by minute updates. The live scroll can only last 10 seconds at a time, when the watch is ‘active’, due to a strict battery saving restriction implemented by Garmin. During the live scroll, the graph shifts pixel by pixel, with the right most data containing the latest heart rate. If you want the latest graph data at any time, then you just have to ‘activate’ your watch using the wrist gesture (demonstrated below - as the watch is activated the screen turns on and the graph starts displaying live heart data and at the end the watch goes back to ‘sleep’ mode). 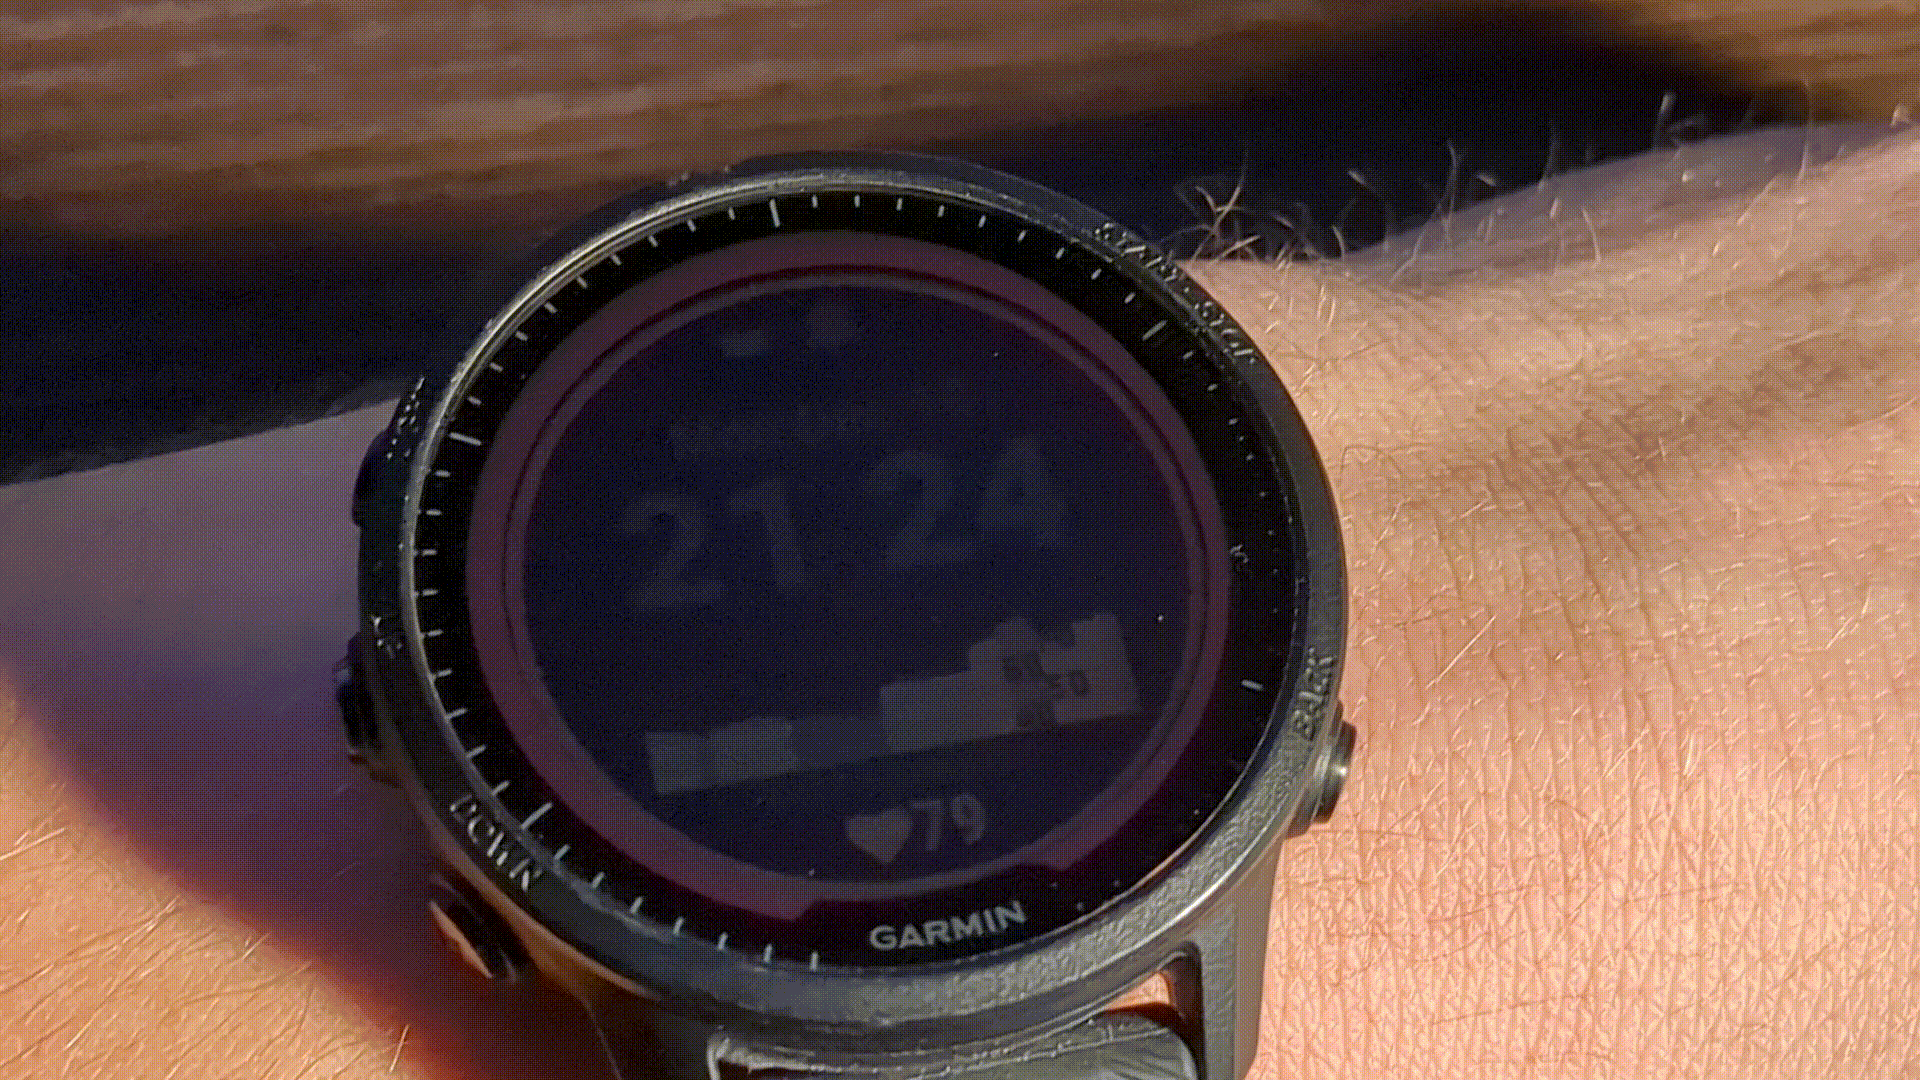
Outside of my heart rate during jumping jacks, I observed many interesting things. Most captivating to me was my heart rate in a sitting and working context; one’s heart beats per minute can be in the 40’s or the 80’s, all while doing the exact same thing. One’s heart rate can drift away very easily from a steady rest rate to an elevated rate. Get carried away with a thought and next thing you know your heart rate went from the 40’s to the 70’s over the span of a minute. My heart rate is the calmest when I am deeply focused on a topic. These observations inspired the following two questions: How do I go from one heart rate to another, and how do I become more self aware of my body? I will not go into the details of the experiments that followed these questions, as this is not a health blog, but will mention that breathing techniques were very helpful. Having this new, easy access to my heart rate and its recent history, I was able to learn a lot and continue to learn much. This observation process worked in a feedback loop; as you read the data that is coming to you about your body, you modify your behaviour (like breathing) or environment, to see if you can register a different response from your body (lower heart rate for example). Yes, it is likely and most definitely true: there are many papers on this topic describing how effective it is or not for tracking stress. However, at the time I was too excited to start coding on this project and decided not to get bogged down in the academic papers, and their potentially uncertain conclusions. Here is a video of another project dealing with this feedback mechanism. Coding It UpProgramming the watch face was not a linear process. There were many uncertainties and unknowns along the way. For some of these unknowns I was not sure if the project could be finished, while for some others it was just a matter of debugging. Just as my heart rate went up and down, so did my concern for the project’s feasibility. The milestones of uncertainty in order of thought were the following:
I wrote these series of questions down for the non-technical reader (you?) to bring them along with me on this journey. They weren’t really that “serious” or cliff hanger like. For any programming project this is a common process, especially for those projects which are do-it-yourself. I am sure you encounter these thought paths in the various projects you work on. For a more “serious” project I would spend more time in the planning phase - here I was just itching to start coding right away! For the technical reader, who is looking to create their own watch face, Garmin provides the ability to simulate your watch on the computer, so the development becomes very quick. The programming is straight forward, and Github & Garmin forums provide a plethora of examples to assist you in your project. The code I wrote can be found here, hosted on github for everyone to use and modify! In regard to the code, I was most satisfied with the the data structure used in storing the incoming heart rate. For this structure I used an array as a linked list for ease of handling fresh/stale data, with the added condition that the data entries in the array are equally spaced apart in time, and that there is logic to handle spotty/missing data. In addition, I implemented tests for the data structure, to give confidence in its usability, and therefore allow for reuse of the code in other applications with live sensor data. The graph code here turned out very aesthetically pleasing. I was happy to conquer this, as one of my the concerns when coding up the watch was “will it look good?”. 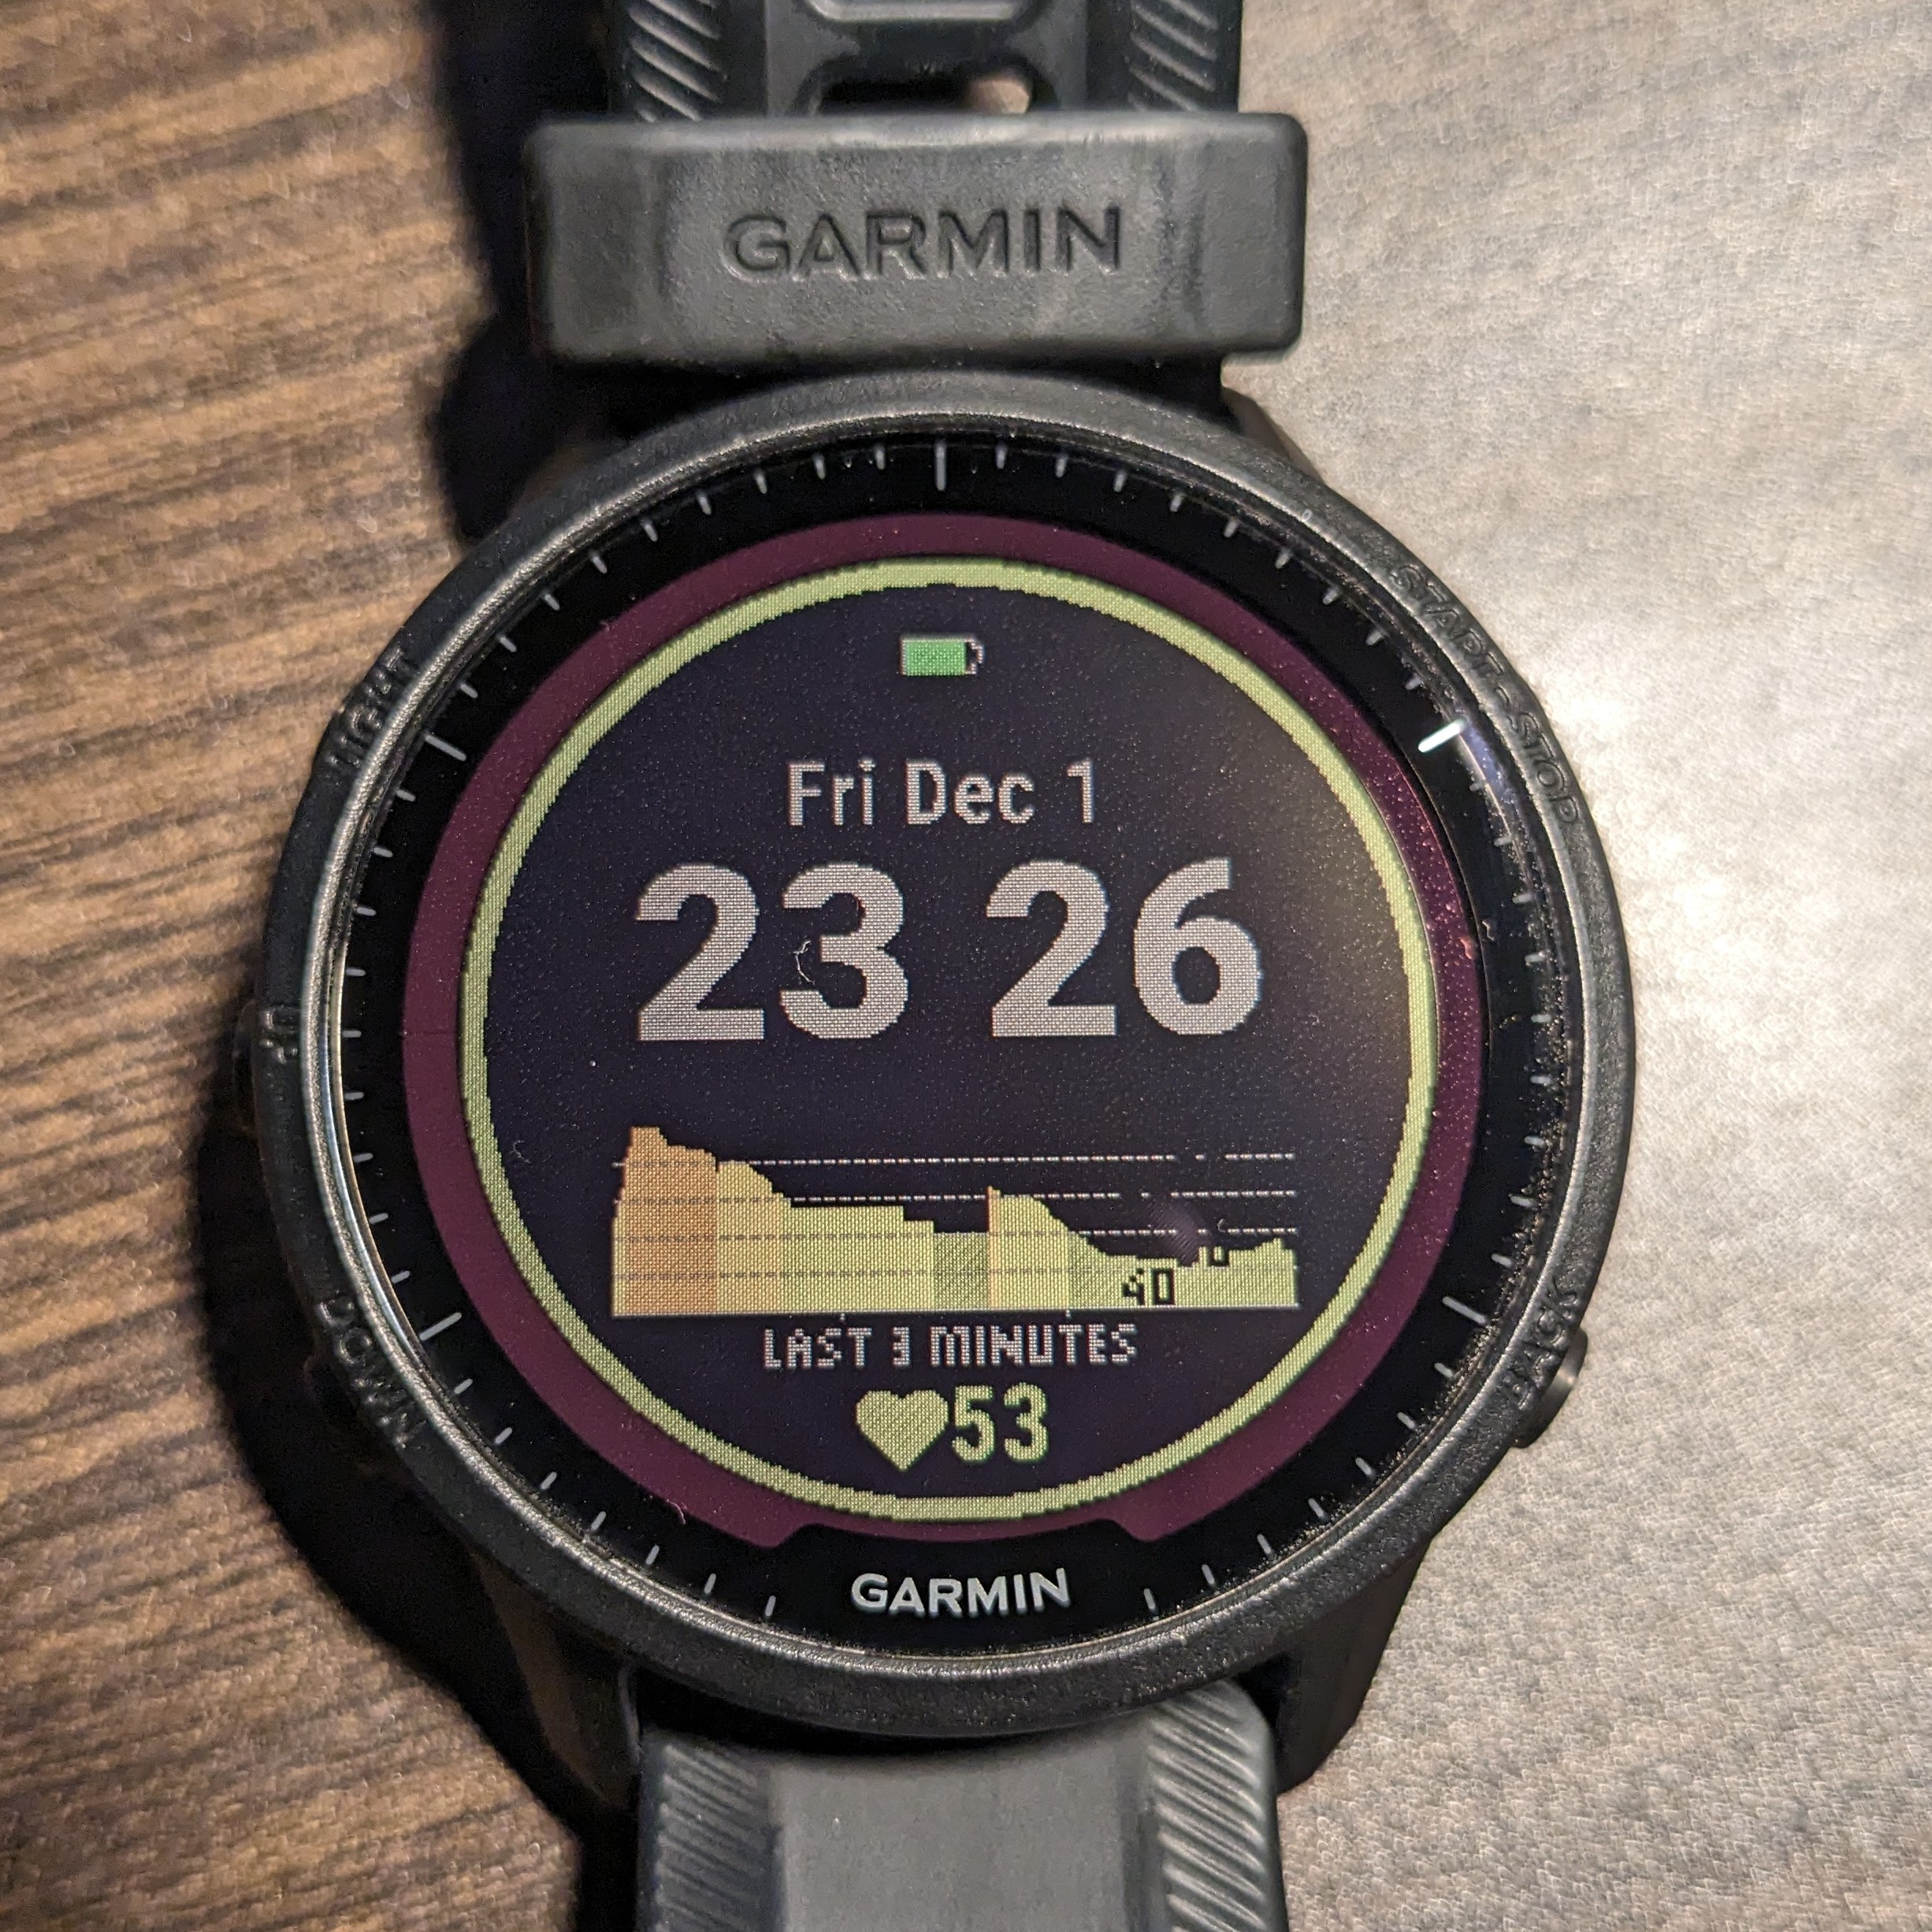
There are lots of ways to customize the aesthetics of your watch face programmatically. Many other custom watch faces can be found in Garmin’s app store, which has all sorts of applications like finding your phone, finding your car, displaying the latest bitcoin price, marine autopilot and many a styled, refined, and exquisite watch faces to match one’s taste. ConclusionPerhaps some version of my watch face design was already created and lost to time amongst the thousands of other watch faces in the app store. Regardless, I viewed the exercise of creating a watch face very useful to me, as it was a foray into creating other additional Garmin apps and watch faces. I am still interested in getting access to a ‘live’ stress metric for which I already have already some leading links (1, 2, 3). Furthermore, the watch can be connected to custom mobile apps via Garmin’s Mobile SDK, which opens up an entire universe of internet-of-things related based applications. Before we (the reader and I) get flooded with an ocean of ideas, I will mention that am glad I was able to focus on just one idea and see it through its completion. I am grateful to Garmin for providing me with a platform to able to create something like this. It is very easy nowadays to get amazing insight about one’s own body. However, I think it is important not to over index on all this. You don’t even need a watch to measure your heart rate. Remember not to hunch over and obsess; don’t become a “Bionicle Man”. |
Introduction
Hello dear reader! I am writing a new blog post as it would be amiss of me to miss adding a single post in the fading year of two thousand and twenty-three. During a small part of this busy busy year I have been preoccupied with my Garmin watch. My first watch model was a gift, and I initially thought it was a silly thing until I started using it.
Garmin watches allow you to track your heart rate and GPS coordinates. This allows you to understand how hard you are exerting yourself and how far you went when running, cycling, swimming, etcetera. Garmin’s data sharing ability allows you to share this information with friends in order to see what new bike routes or challenges your friends have completed. This social aspect for me was the primary benefit of the watch, represented in thoughts such as: “…wait what?… so and so biked 40km across a frozen lake on a fat bike?” and “That’s an interesting cycling route. I will try that out tomorrow.”
You may be thinking: “…ah another tracking mechanism that I don’t care for” or “who has got time or knowledge to view and make use of these metrics?”. These are valid concerns, but the watch is what you make of it. I found the watch great for helping me become more mindful of my breath control during exercise, training in specific heart rate zones, and changing up my exercise routes. The watches are now so advanced that they even come with a GPS map that can assist you in some of your longer routes - the technology is very advanced!
Heart Rate Variability
Outside of social and exercise metrics, I wasn’t receiving too much information about my body. It wasn’t until I upgraded to the 955 Solar Garmin watch that I started getting some additional metrics, such as stress level. At first I was very confused by this variable. How is it that I am sitting down, and this watch is claiming that I am stressed at a stress level of 80 out of 100… during a vacation where I do, and should feel calm?
The stress metric is based on the heart rate and heart rate variability (hrv). Garmin scales the metrics from 0 to 100 in order of increasing stress. Below is a sample image of Garmin watch view of my stress during a morning where I had to go for an early flight.
The stress metric was not immediately available from the watch’s resting face, and I had to press one of the side buttons to see the live data. I was so preoccupied with all of this that my friend nicknamed me the “Bionicle Man”. Half man, half robot - obsessed and hunched over my watch, looking at my metrics throughout all moments of the vacation.
The Watch App
I decided to combine my old love for little programming projects with this new found curiosity in the dynamic stress metric. Fortunately, Garmin has a wonderful software development kit and detailed forums that allows one to create their own watch faces and apps. I set out to create a stress monitoring watch!
Unfortunately, when programming the watch face, one cannot get access to a ‘live’ stress metric. Therefore, I used the next best thing for displaying live stress data, which was the live heart rate, as these two fields are correlated. I created a watch face with a graph that displayed the heart rate for the past three minutes, and that refreshed every second. I colour coded the heart rate in the graph in order to communicate to the user when their heart rate was exceeding a resting rate. Take a look at the resulting watch face:
You can see the code at https://github.com/mannyray/StressWatchFace
This graph allows you to look into the history of your heart rate; to see if your heart rate is accelerating or decelerating. For the gif above, I modified the code to allow for playback of live recorded data, to demonstrate how the watch face works (it’s not actually measuring the pulse of the table). For the represented data, I started in a sitting position, stood up did some jumping jacks, and at last I sat back down. My heart started at a resting rate in the 40’s/50’s and then went up to the 90’s, and then went back down to resting. The gif shows minute by minute updates. The live scroll can only last 10 seconds at a time, when the watch is ‘active’, due to a strict battery saving restriction implemented by Garmin. During the live scroll, the graph shifts pixel by pixel, with the right most data containing the latest heart rate. If you want the latest graph data at any time, then you just have to ‘activate’ your watch using the wrist gesture (demonstrated below - as the watch is activated the screen turns on and the graph starts displaying live heart data and at the end the watch goes back to ‘sleep’ mode).
Outside of my heart rate during jumping jacks, I observed many interesting things. Most captivating to me was my heart rate in a sitting and working context; one’s heart beats per minute can be in the 40’s or the 80’s, all while doing the exact same thing. One’s heart rate can drift away very easily from a steady rest rate to an elevated rate. Get carried away with a thought and next thing you know your heart rate went from the 40’s to the 70’s over the span of a minute. My heart rate is the calmest when I am deeply focused on a topic.
These observations inspired the following two questions: How do I go from one heart rate to another, and how do I become more self aware of my body? I will not go into the details of the experiments that followed these questions, as this is not a health blog, but will mention that breathing techniques were very helpful. Having this new, easy access to my heart rate and its recent history, I was able to learn a lot and continue to learn much.
This observation process worked in a feedback loop; as you read the data that is coming to you about your body, you modify your behaviour (like breathing) or environment, to see if you can register a different response from your body (lower heart rate for example). Yes, it is likely and most definitely true: there are many papers on this topic describing how effective it is or not for tracking stress. However, at the time I was too excited to start coding on this project and decided not to get bogged down in the academic papers, and their potentially uncertain conclusions. Here is a video of another project dealing with this feedback mechanism.
Coding It Up
Programming the watch face was not a linear process. There were many uncertainties and unknowns along the way. For some of these unknowns I was not sure if the project could be finished, while for some others it was just a matter of debugging. Just as my heart rate went up and down, so did my concern for the project’s feasibility. The milestones of uncertainty in order of thought were the following:
- “Is programming a custom watch face even possible?”
- “How do I get my environment setup?”
- “How do I get a basic app going?”
- “How do I print some text?”
- “How do I add military time?”
- “How do I transfer the custom watch face to my watch face?”
- “What data structure should I use to store incoming heart rate data?”
- “How do I add some tests to make sure the data structure is solid?”
- “Can I get live stress data for every second?”
- “What about heart data?”
- “How do I deal with this ‘out of memory’ error?”
- “Can I get the watch to display a live graph all the time, or only ten seconds at a time?”
- “How do I make this graph look nice?”
- “How do I add custom fonts to my watch face?”
- “Which colours are available for my watch face and how do I assign them per increasing heart rate range?”
- “How do I align everything on my watch to my taste?”
- “What range of heart rate history should I add to my watch: 10, 5 or 3 minutes?”
- “How do I want to organize and clean up the code to make a public repository to share with others?”
- “What do I want to write in a blog post about the watch face to share with my friends?”
I wrote these series of questions down for the non-technical reader (you?) to bring them along with me on this journey. They weren’t really that “serious” or cliff hanger like. For any programming project this is a common process, especially for those projects which are do-it-yourself. I am sure you encounter these thought paths in the various projects you work on. For a more “serious” project I would spend more time in the planning phase - here I was just itching to start coding right away!
For the technical reader, who is looking to create their own watch face, Garmin provides the ability to simulate your watch on the computer, so the development becomes very quick. The programming is straight forward, and Github & Garmin forums provide a plethora of examples to assist you in your project. The code I wrote can be found here, hosted on github for everyone to use and modify! In regard to the code, I was most satisfied with the the data structure used in storing the incoming heart rate. For this structure I used an array as a linked list for ease of handling fresh/stale data, with the added condition that the data entries in the array are equally spaced apart in time, and that there is logic to handle spotty/missing data. In addition, I implemented tests for the data structure, to give confidence in its usability, and therefore allow for reuse of the code in other applications with live sensor data. The graph code here turned out very aesthetically pleasing. I was happy to conquer this, as one of my the concerns when coding up the watch was “will it look good?”.
There are lots of ways to customize the aesthetics of your watch face programmatically. Many other custom watch faces can be found in Garmin’s app store, which has all sorts of applications like finding your phone, finding your car, displaying the latest bitcoin price, marine autopilot and many a styled, refined, and exquisite watch faces to match one’s taste.
Conclusion
Perhaps some version of my watch face design was already created and lost to time amongst the thousands of other watch faces in the app store. Regardless, I viewed the exercise of creating a watch face very useful to me, as it was a foray into creating other additional Garmin apps and watch faces.
I am still interested in getting access to a ‘live’ stress metric for which I already have already some leading links (1, 2, 3). Furthermore, the watch can be connected to custom mobile apps via Garmin’s Mobile SDK, which opens up an entire universe of internet-of-things related based applications.
Before we (the reader and I) get flooded with an ocean of ideas, I will mention that am glad I was able to focus on just one idea and see it through its completion. I am grateful to Garmin for providing me with a platform to able to create something like this. It is very easy nowadays to get amazing insight about one’s own body. However, I think it is important not to over index on all this. You don’t even need a watch to measure your heart rate.
Remember not to hunch over and obsess; don’t become a “Bionicle Man”.